JEP draft: Faster Startup and Warmup with ZGC
| Owner | Erik Österlund |
| Type | Feature |
| Scope | Implementation |
| Status | Submitted |
| Component | hotspot / gc |
| Discussion | hotspot dash gc dash dev at openjdk dot org |
| Effort | M |
| Duration | M |
| Reviewed by | Alex Buckley, Dan Heidinga |
| Created | 2024/04/05 09:47 |
| Updated | 2026/02/06 17:21 |
| Issue | 8329758 |
Summary
Enhance the Z Garbage Collector to more swiftly allocate memory in response to an application's needs. Additionally, exploit new memory management features in Linux. Together, these enhancements improve JVM startup and application warmup.
Goals
- Minimize startup time by creating only a small initial heap, reducing OS overhead.
- Respond more efficiently to an application’s growing need for memory.
- Avoid stalling the application by obtaining memory for the heap in the background.
- Improve ZGC’s mechanical sympathy with the OS and provide tuning options for advanced users.
Non-Goals
- It is not a goal to use the same memory management techniques on all operating systems. For example, we may use large pages by default on Linux but not on Windows.
Motivation
The Z Garbage Collector (ZGC) introduced in JDK 15 is designed for low latency and high scalability. ZGC does most of its work while application threads are running, pausing those threads only briefly. ZGC's low pause times are independent of heap size: Workloads can use heap sizes from a few hundred megabytes all the way up to multiple terabytes and still enjoy low pause times.
Although pause times are independent of heap size with ZGC, the frequency of garbage collection is not. By default, the JVM requests only a small percentage of memory for the heap; this minimizes overhead at startup but also means garbage collection will likely trigger early and frequently, as the application creates objects and thereby allocates memory faster than the garbage collector can free it.
To avoid stalling the application’s allocation, ZGC expands the heap by asking the OS for more memory; however, this can be slow, impeding warmup of the application. To avoid impeding warmup, users can configure ZGC to prepare (“pre-touch”) memory at startup; this speeds up heap expansion and accommodates rapid allocation, but it substantially delays startup.
In theory, users can configure the initial heap size to smoothly trade off startup and warmup. In practice, however, users tend to adopt one of the following extremes:
- Good startup, bad warmup. For example,
java -Xms2M -Xmx2G ...sets the initial heap size (-Xms) to 2MB and sets the maximum heap size (-Xmx) to 2GB. The application starts quickly because the initial heap size is small, minimizing overhead, but pays a warmup cost because all other memory used for the heap -- up to 2GB -- is only obtained on-demand. - Bad startup, good warmup. For example,
java -Xms2G -Xmx2G –XX:+AlwaysPreTouch ...sets both the initial and the maximum heap size to 2GB, and enables pre-touching. The application starts slowly -- potentially seconds rather than milliseconds -- because the JVM works on preparing the entire 2GB heap; but after that price is paid, the application will warmup and run quickly.
Ideally, no user would have to make this tradeoff. ZGC should be capable of growing the heap rapidly from megabytes to terabytes while preserving low latency during startup, warmup, and beyond.
Description
We propose to enhance ZGC so that the JVM:
- Starts up more quickly, by requesting only 2MB for the heap by default.
- Warms up more quickly, by requesting memory concurrently.
- Allocates memory more efficiently, in units of 2MB rather than 4KB by default.
No configuration of initial heap size (-Xms) or maximum heap size (-Xmx) is necessary or desirable; nor is it necessary to specify -XX:+AlwaysPreTouch. You need only choose ZGC when running your application:
java -XX:+UseZGC -jar app.jarIn a case study of a server application running with enhanced ZGC, startup time (the time until the first response) is 38% lower and the warmup time needed (the additional time until peak performance is reached) is 90% lower.
A primer on modern memory management
The JVM presents applications with the illusion of infinite heap memory. The role of a JVM garbage collector such as ZGC is to implement heap memory given the finite resources of the computer running the JVM.
1. Virtual and physical memory
The JVM is an OS process with a 64-bit address space. The address space is virtual, so all memory access by the JVM occurs at virtual addresses. The CPU translates the virtual addresses to physical addresses in RAM. The JVM cannot access RAM directly.
The OS supports the CPU by dividing the virtual and physical address spaces into pages, typically 4KB in size, and keeping a page table which maps virtual pages in the virtual address space to physical pages in RAM. Consecutive virtual pages are not necessarily mapped to consecutive physical pages. ZGC uses OS APIs to manipulate the page table and thereby control how the heap, in virtual pages of the JVM process, is physically organized in RAM.
2. Reserving virtual memory
At startup, ZGC reserves a contiguous range in the virtual address space that is 16 times the maximum heap size (-Xmx). If, e.g., the maximum heap size is 1GB then ZGC will reserve 16GB of virtual memory, which works out to ~4M virtual pages. Reserving virtual pages is mere bookkeeping by the OS, so it is fast. No mapping between virtual and physical addresses is recorded in the page table. (The reason for such a vast virtual address space is to better manage fragmentation induced by large objects, discussed below.)
3. Committing physical memory
At startup, no physical memory is used to store any of the vast number of reserved virtual pages. To obtain physical memory for the heap, ZGC asks the OS to commit a fixed number of physical pages for the JVM process. The number corresponds to the initial heap size (-Xms). If, e.g., the initial heap size is 2MB then ZGC needs to create a heap comprising 512 virtual pages and will, accordingly, ask the OS to commit 512 physical pages.
Unlike reserving virtual pages, committing physical pages is no mere bookkeeping. The OS must first find unused physical pages, which may entail swapping out the virtual pages of other processes which currently map to them. The OS then zeroes the physical pages to avoid data leaks. Only then can ZGC map the physical pages to virtual pages in the heap of the JVM process using OS APIs.
4. Expanding the heap
As the Java application runs, it creates objects in the heap and assigns and accesses their fields. The JVM implements these actions by writing to and reading from the virtual pages which store the heap. Since those virtual pages are mapped to physical pages, the application’s actions in the Java virtual machine are ultimately reflected in the physical machine.
At some point, the application may create an object for which no space can be found in the virtual pages which store the heap. To avoid throwing OutOfMemoryError, ZGC expands the heap. This means that ZGC asks the OS to commit more physical pages for the JVM process and thereby make more virtual pages available to store the heap. If, e.g., ZGC expands the heap from 2MB to 16MB, it needs 3,584 more virtual pages (from the ~4M reserved earlier) to map to 3,584 more physical pages.
As with the initial heap creation, heap expansion can be slow because committing physical pages is no mere bookkeeping (involves finding unused physical pages, zeroing them, etc).
5. Contracting the heap
ZGC divides the memory in virtual pages into regions of between 2MB and 32MB. As ZGC runs, it detects when a region no longer contains live objects. Such a region, which now contains only garbage, is said to be evacuated. The virtual pages which underlie an evacuated region are no longer needed; this could be as many as 8,192 virtual pages in a 32MB region.
The virtual pages of evacuated regions may be used to satisfy subsequent object allocations, or alternatively, be relinquished back to the OS, effectively contracting the heap. Contracting the heap will increase the frequency of garbage collection, so ZGC heuristically chooses to contract the heap when the memory overhead of garbage in the heap seems more problematic than the CPU overhead of garbage collection.
To contract the heap, ZGC asks the OS to unmap the physical pages that are presently mapped to those virtual pages. Unmapping virtual pages from their physical pages does not cause the OS to uncommit the physical pages from the JVM process, so ZGC explicitly frees the physical pages to complete heap contraction.
6. Harvesting memory
ZGC repurposes the physical pages in evacuated regions to speed up object creation. For example, consider the array created by new int[1024*1024]: It is a large (4MB) object for which ZGC must find contiguous space in the heap. Even if the heap has sufficient free space in total, the space may be scattered across discontiguous virtual pages. Most garbage collectors compact the heap by moving objects from one region to another, laboriously trying to construct a region with at least 1,024 contiguous empty virtual pages of 4KB each. However, this generally requires a garbage collection cycle -- where ZGC walks the heap, marks live objects, and relocates them -- which is expensive.
ZGC uses an OS facility called remapping to construct a region with contiguous space. Remapping modifies the page table so that a physical page mapped to one virtual page is mapped to another virtual page instead. Since an evacuated region of the heap holds only garbage, the virtual pages which underlie the region are no longer needed; the physical pages mapped to those virtual pages can safely be remapped to other virtual pages. Accordingly, ZGC “harvests” those physical pages by remapping them to a contiguous range of virtual pages in the vast virtual address space reserved at startup.
Harvesting lets ZGC find heap space for a large object several orders of magnitude faster than running a garbage collection cycle to compact the heap. ZGC’s memory usage does not change because the number of physical pages committed does not change; they are merely repurposed.
Faster startup with a small initial heap
Traditionally, ZGC committed 0.2% of RAM for the initial heap at startup. This policy resulted in, e.g., a 2MB initial heap on a machine with 1GB RAM, and a 256MB initial heap on a machine with 128GB RAM.
Generally, Java applications do not detect how much memory is available at startup and adapt their allocation to it. Instead, deployers make empirical observations of the application’s performance with various initial heap sizes and then commit to a value for -Xms in the application’s startup script, perhaps choosing to trade off good startup for bad warmup as mentioned earlier.
Assessing the impact of initial heap size on startup is straightforward: for a given value of -Xms, deployers can directly measure the time from starting the JVM to processing the first request. However, the impact of initial heap size on warmup is significantly harder to assess. Its impact is not on the first request but rather on the distribution of response times for multiple requests and how the distribution changes over time. Hence, rigorously assessing the impact of initial heap size on warmup requires sampling the response time distribution and plotting it over time; this is very rarely done in practice.
We propose that ZGC always commits 2MB for the initial heap. Since committing memory is more than mere bookkeeping for the OS, it can be slow, so committing as little as possible – enough for only one 2MB region in the heap – makes startup as fast as possible. ZGC uses rapid expansion, discussed next, to adapt the heap size to the true allocation needs of the application.
Improving warmup with rapid heap expansion
Applications will start quickly with a small initial heap, but usually it will be insufficient. The JVM will trigger frequent garbage collection cycles as the application creates more and more objects. Collecting only a small heap means these cycles are quick, and ZGC uses dedicated worker threads to collect without blocking application threads, but it is possible that the rate of garbage collection cannot match the application’s rate of object creation. In this case, ZGC will have to use application threads to commit more physical memory or the JVM will have to pause object creation until the end of the cycle; either way, the application will pause.
We propose that ZGC detects a high frequency of garbage collection cycles and takes it as a signal to asynchronously expand the heap by committing more physical pages. Further, ZGC will expand the heap exponentially so there is a logarithmic bound to the number of expansions needed to achieve a stable heap size. Increasing the heap by successively larger amounts requires waiting for the OS to commit more and more physical pages, which involves zeroing its memory. This process is done incrementally so that freshly committed memory can immediately alleviate work otherwise required for the GC to reclaim garbage more frequently.
ZGC will also estimate the normal allocation rate for the application over time and use it to proactively expand the heap in the background. This allows ZGC to reduce the frequency of collections, in turn reducing the CPU overhead of garbage collection and improving the throughput of the application. The time spent waiting for the OS to commit physical pages is incurred by ZGC worker threads and not by application threads, providing the application with more consistent execution and fewer pauses. ZGC throttles its threads’ CPU usage to no more than 25% to ensure that application threads are never starved of CPU.
Faster warmup with concurrent pre-touching
Suppose ZGC has just mapped virtual pages to newly committed physical pages using OS APIs. The OS does not update the page table to reflect the mapping immediately, since some processes will not use all their virtual pages. Consequently, when the application creates an object that causes the JVM to write to one of the newly mapped virtual pages for the first time, a “page fault” is incurred; only then does the OS map the “touched” virtual page to a physical page in the page table.
A high frequency of page faults can often be observed during warmup, when the application creates many objects and the JVM writes to virtual pages for the first time. To improve warmup in JDK 25, users were advised to start the Java runtime with the -XX:+AlwaysPreTouch option which causes ZGC to write to (pre-touch) the virtual pages of the initial heap immediately after mapping them to newly committed physical pages.
However, this has the effect of concentrating all the page faults for the initial heap into the period of JVM startup, making it slower. Users who set the initial heap size (-Xms) to a small value may notice no impact, but users who set the initial heap size to the same as the maximum heap size (-Xmx) will likely notice much slower startup. The following table shows wall-clock times for startup with -XX:+AlwaysPreTouch:
-Xms2M   -Xmx2M     0.034s
-Xms20M  -Xmx20M    0.041s
-Xms200M -Xmx200M   0.110s
-Xms2G   -Xmx2G     0.634s
-Xms20G  -Xmx20G    5.672s
In JDK NN, ZGC performs pre-touch not at startup but rather when the heap is expanded. Whenever a ZGC worker thread expands the heap by committing more physical pages, it writes to the mapped virtual pages, forcing the OS to commit distinct physical pages immediately instead of waiting until the JVM (on behalf of the application) writes to the virtual page.
Superior memory management
Modern applications routinely process gigabytes of data, so organizing virtual memory as small 4KB pages is inefficient. Since the 2000s, Linux and Windows have supported large pages (sometimes known as huge pages) that are typically 2MB in size. If an application creates, e.g., an 8MB array, then it can be stored in four large pages instead of 2,048 small pages.
Having fewer but larger pages makes for faster access. Because the virtual address space is huge, the page table used to translate virtual addresses to physical addresses is organized hierarchically: When the JVM dereferences a virtual address, the CPU looks through successive levels of the hierarchy to yield a physical address. Using large pages lets the CPU skip one level of lookup. In addition, the CPU has a cache of recent virtual-to-physical mappings, and a large page occupies only one cache entry versus 512 entries for the corresponding small pages; this makes a cache hit more likely for a larger range of addresses.
Historically, the use of large pages was disabled by default in the Linux kernel. Enabling large pages required configuration by the superuser but this was not practicable in many Java environments.
Linux 6.1, released in 2022, enhanced the OS API for memory mapping. Any process can now instruct the OS to “upgrade” a specified range of small virtual pages into large pages; no kernel configuration is required. ZGC will use this API to "upgrade" small pages to large pages during heap expansion; eventually, the entire heap will be backed by large pages. Since upgrading can be a costly operation, potentially requiring physical memory to be defragmented, it is performed by ZGC worker threads to minimize the impact on the application.
Case study in faster startup and warmup
We explore startup and warmup for the Spring PetClinic application on a machine with 32GB RAM.
To quantify warmup, we look at the response time of the application in the period immediately following JVM startup. Specifically, we look at the P99 response time: the response time that is observed for the slowest 1% of requests. We assume that an acceptable P99 response time for this application is 20ms, so if P99 stays below 20ms in the period following startup, the application has warmed up; if P99 spikes above 20ms in this period, the application has not yet warmed up. In other words, consistent low latency means the application has warmed up.
We use an in-house tool to generate load on the application. The tool generates a single request to simulate the health check performed by a load balancer, then generates 1,000 requests per second increasing linearly to 30,000 requests per second over a 10 second ramp up period. The ramp up period simulates a load balancer configured with an awareness that a Java application does not achieve peak performance until the JVM has JIT-compiled it to native code. If the application were to receive 30,000 requests per second immediately, the response rate would be much lower than the request rate and P99 response times would be measured in seconds rather than milliseconds. By gracefully increasing the request rate, acceptable latency can be achieved throughout. After the ramp up period, the tool continues to send 30,000 requests per second for two minutes.
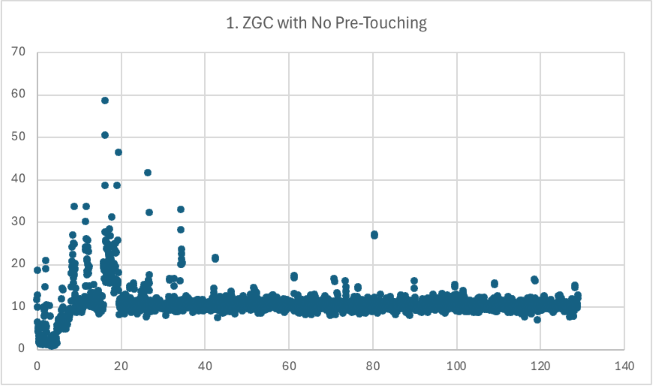
Scenario 1 (JDK 25)
To minimize startup, we configure the Java runtime with a small initial heap size (2MB) and a large maximum heap size (20GB).
java -XX:+UseZGC -Xms2M -Xmx20G -jar warmup.jarStartup takes 5.425s followed by 0.436s to serve the health check request. Unfortunately, P99 repeatedly spikes above 20ms during the ramp up period because ZGC has to expand the heap from 2MB to 20GB as the application demands more memory. Without rapid heap expansion in JDK 25, ZGC needs to incrementally commit physical pages and trigger page faults on the first access of their virtual pages, leading to poor latency. As the seconds tick by, allocations are increasingly satisfied in previously committed memory “recycled” by ZGC, rather than freshly committed memory, and P99 falls from 59ms to 20ms in the 20 seconds after the ramp up period. By 40 seconds, P99 spikes are rare, and by 80 seconds, the application has warmed up.
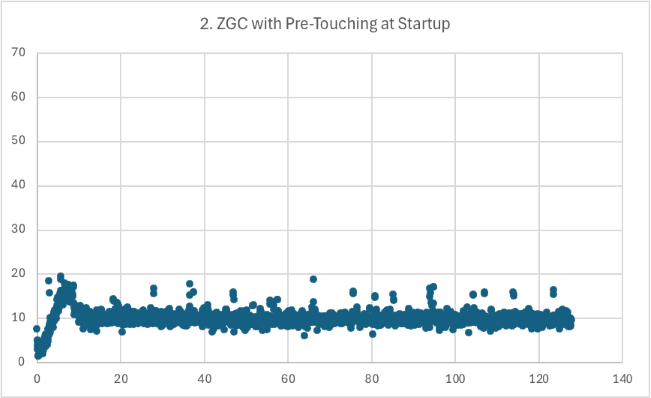
Scenario 2 (JDK 25)
To improve warmup, we configure the Java runtime with a large initial heap size (20GB) and ensure it is pre-touched.
java -XX:+UseZGC -Xms20G -Xmx20G -XX:+AlwaysPreTouch -jar warmup.jarStartup is worse due to pre-touching all 20GB -- 9.009s rather than 5.425s – but warmup is visibly better due to having plenty of committed physical pages. The first 7.8 seconds of the ramp up period show increasing P99 as ZGC expands the heap and starts to collect garbage. After that, the application is warmed up and there are no P99 spikes above 20ms.
Scenario 3 (JDK NN)
We rely on the enhancements to ZGC to combine the startup benefit of a small initial heap with the warmup benefits of concurrently pre-touching and rapidly expanding the heap:
java -XX:+UseZGC -jar warmup.jarStartup takes 5.400s followed by 0.441s for the health check request; this is essentially the same as Scenario 1 but 38% lower than Scenario 2. Only 8.0s of ramp up is needed to reach peak performance; this is essentially the same as Scenario 2 but 90% lower than Scenario 1. Furthermore, P99 stays below 20ms from start to finish as the application is always using a heap in pre-touched memory.
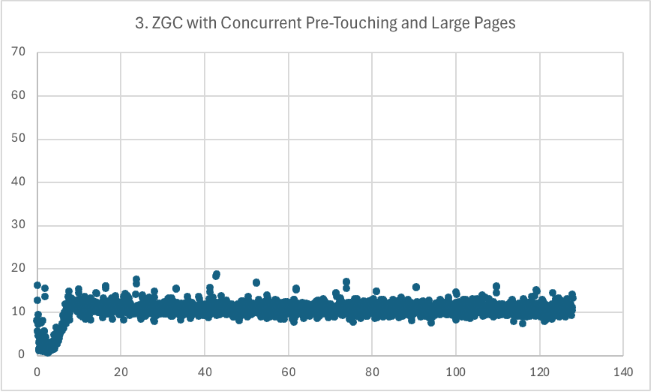
The improvement in warmup from 80s in Scenario 1 to 8s in Scenario 3, while keeping startup low, can be attributed to the combination of concurrent pre-touching, rapid heap expansion, and use of large pages. We can demonstrate this by enabling and disabling the features individually.
- If we rerun Scenario 3 with rapid expansion and large pages but without concurrent pre-touching, then warmup takes 34s.
- If we rerun Scenario 3 with rapid expansion and concurrent pre-touching but without large pages, then warmup takes 18s.
Having all three features working together lowers warmup to the point where, at 8s, it occurs entirely within the ramp up period. This is significant because when even the slowest 1% of requests are processed promptly, more CPU resources are available for the JVM to JIT-compile the application to machine code.
Alternatives
Instead of committing 2MB for the initial heap, ZGC could commit a larger amount. The need for rapid expansion would be less. However, if the user has said nothing about the initial heap size, it makes sense to not assume it should be larger. Some applications create very few objects, and a larger initial heap would not be useful to them. The disadvantages of starting with an initial heap that is too small for an application are mitigated by committing and pre-touching memory for the heap while the application is running, and by expanding the heap exponentially.
Risks and Assumptions
A risk of the initial heap size being 2MB regardless of environment is that applications may have been tuned to expect a larger initial heap size in their environments. For example, an application tuned to run on a machine with 128GB RAM, where the initial heap defaults to 256MB in JDK 25, may experience slower warmup on JDK NN with a 2MB initial heap. The slower warmup may manifest as a prolonged period after startup when the P99 response time routinely exceeds a duration defined by Service Level Agreement. We assume that deployers are familiar with the need to re-tune their GC configurations after notable enhancements to JVM functionality.
Many applications are started by scripts that configure the Java runtime with a relatively small initial heap (far less than 256MB), and these applications will likely warm up better on JDK NN than JDK 25. Across the whole Java ecosystem, we assume that the enhancements to ZGC in this JEP are a net positive for startup and warmup.
Future Work
The key to fast warmup is lowering heap usage by spending CPU resources on concurrent garbage collection, while raising heap capacity by spending CPU resources on concurrent committal of memory. We will investigate how to more explicitly balance CPU resources between these two activities to minimize latency in the first few seconds of run time, thus improving warmup.
Ahead-of-Time Code Compilation from Project Leyden will remove the overhead of JIT-compiling the application to machine code during warmup. This will make more CPU resources available to ZGC for either concurrent garbage collection or concurrent memory committal or both.