JEP 509: JFR CPU-Time Profiling (Experimental)
| Authors | Jaroslav Bachorík, Johannes Bechberger, & Ron Pressler |
| Owner | Johannes Bechberger |
| Type | Feature |
| Scope | JDK |
| Status | Closed / Delivered |
| Release | 25 |
| Component | hotspot / jfr |
| Discussion | hotspot dash jfr dash dev at openjdk dot org |
| Effort | M |
| Duration | S |
| Reviewed by | Markus Grönlund |
| Endorsed by | Vladimir Kozlov |
| Created | 2024/08/04 10:34 |
| Updated | 2025/07/31 10:19 |
| Issue | 8337789 |
Summary
Enhance the JDK Flight Recorder (JFR) to capture more accurate CPU-time profiling information on Linux. This is an experimental feature.
Motivation
A running program consumes computational resources such as memory, CPU cycles, and elapsed time. To profile a program is to measure the consumption of such resources by specific elements of the program. A profile might indicate that, e.g., one method consumes 20% of a resource, while another method consumes only 0.1%.
Profiling can help make a program more efficient, and developers more productive, by identifying which program elements to optimize. Without profiling, we might optimize a method that consumes few resources to begin with, having little impact on the program's overall performance while wasting effort. For example, optimizing a method that takes up 0.1% of the program’s total execution time to run ten times faster will only reduce the program's execution time by 0.09%.
JFR, the JDK Flight Recorder, is the JDK's profiling and monitoring facility. The core of JFR is a low-overhead mechanism for recording events emitted by the JVM or by program code. Some events, such as loading a class, are recorded whenever an action occurs. Others, such as those used for profiling, are recorded by statistically sampling the program's activity as it consumes a resource. The various JFR events can be turned on or off, allowing a more detailed, higher-overhead collection of information during development and a less detailed, lower-overhead collection of information in production.
Two important resources that are commonly profiled are heap memory and CPU.
A CPU profile shows the relative amount of CPU cycles consumed by different methods. This is not necessarily related to the relative amount of total execution time it consumes. A method that sorts an array, for example, spends all of its time on the CPU. Its execution time corresponds to the number of CPU cycles it consumes. In contrast, a method that reads from a network socket might spend most of its time idly waiting for bytes to arrive over the wire. Of the time it consumes, only a small portion is spent on the CPU. Nevertheless, a CPU profile is important even for server applications that perform a lot of IO, as the throughput of such applications may be bound by CPU usage when under heavy workloads.
JFR offers good support for heap allocation profiling, but its support for CPU profiling is lacking. JFR offers an approximation of CPU profiling through a mechanism called the execution sampler. When this mechanism is turned on, JFR obtains a stack-trace (a sample) of Java threads at regular time intervals (say, every 20ms) and emits it in a JFR event. A suitable tool, including JFR's built-in views, can summarize these events into a textual or graphical profile. Only threads that are running, rather than waiting for some event, are sampled, because blocked threads do not consume CPU.
This mechanism works on all OS platforms, but it suffers from some deficiencies:
- It only samples threads that are currently executing Java code and not native code called from Java code.
- When it tries to obtain a sample, it may fail for technical reasons, and it doesn't report the number of such missed samples.
- It selects only a subset of threads for sampling at each interval.
Consequently, the resulting profile may be inaccurate and not reflect the actual CPU usage profile. The inaccuracies are likely to be greater when collecting the samples over a relatively short period (say, one minute).
CPU-time profiling
The ability to accurately and precisely measure CPU-cycle consumption was added to the Linux kernel in version 2.6.12 via a timer that emits signals at fixed intervals of CPU time rather than fixed intervals of elapsed real time. Most profilers on Linux use this mechanism to produce CPU-time profiles.
Some popular third-party Java tools, including async-profiler, use Linux's CPU timer to produce CPU-time profiles of Java programs. However, to do so, such tools interact with the Java runtime through unsupported internal interfaces. This is inherently unsafe and can lead to process crashes.
We should enhance JFR to use the Linux kernel's CPU timer to safely produce a more accurate CPU-time profiles of Java programs. In particular, this kernel mechanism would allow JFR to correctly track CPU cycles consumed by Java programs even when they're running native code.
Better CPU profiles would help the many developers who deploy Java applications on Linux to make those applications more efficient.
Description
We add CPU-time profiling to JFR, on Linux systems only. This feature is experimental for now, so that we may refine it based on experience before making it permanent. We may add CPU-time profiling to JFR on other platforms in the future.
JFR will use Linux's CPU-timer mechanism to sample the stack of every thread running Java code at fixed intervals of CPU time. Each such sample is recorded in a new type of event, jdk.CPUTimeSample. This event is not enabled by default.
This event is similar to the existing jdk.ExecutionSample event for execution-time sampling. Enabling CPU-time events does not affect execution-time events in any way, so the two can be collected simultaneously.
We can enable the new event in a recording started at launch like so:
$ java -XX:StartFlightRecording=jdk.CPUTimeSample#enabled=true,filename=profile.jfr ...Example
Consider a program, HttpRequests, with two threads, each performing HTTP requests. One thread runs a tenFastRequests method that makes ten requests, sequentially, to an HTTP endpoint that responds in 10ms; the other runs a oneSlowRequest method that makes a single request to an endpoint that responds in 100ms. The average latency of both methods should be about the same, and so the total time spent executing them should be about the same.
However, we expect tenFastRequests to take up much more CPU time than oneSlowRequest, since ten rounds of creating requests and processing responses requires more CPU cycles than just one round. If our program becomes CPU-bound under heavy loads, it is tenFastRequest that should be optimized, and a profile should reflect that.
When we can generate a graphical flame graph profile of the program, using the JDK Mission Control tool (JMC) on the recording of the new CPU-time samples, indeed it it becomes clear that the application spends nearly all of its CPU cycles in tenFastRequests:
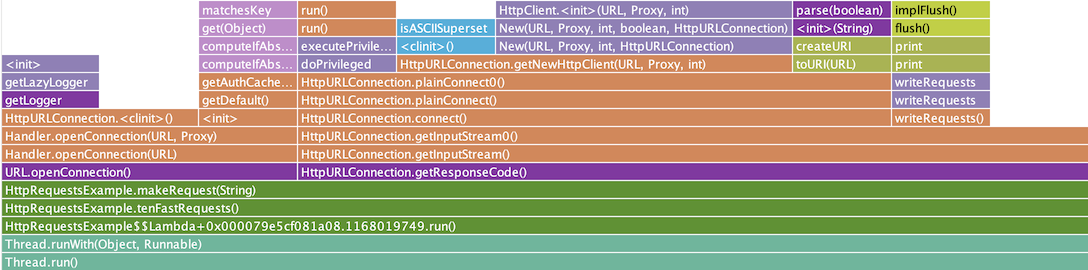
We see this clear difference between the two methods (oneSlowRequest consumes so little CPU compared to tenFastRequests that it doesn't appear in the above profile) even though much of the processing is done in native code. Note that the native functions are not displayed directly, but their CPU consumption is correctly attributed to the Java methods — such as implFlush — that calls them.
A textual profile of the hot CPU methods, i.e., those that consume many CPU cycles in their own bodies rather than in calls to other methods, can be obtained like so:
$ jfr view cpu-time-hot-methods profile.jfrHowever, in this particular example, the output is not as useful as the flame graph.
Event details
The jdk.CPUTimeSample event for a specific stack trace has these fields:
startTime— the CPU time just before walking the stack,eventThread— the identity of the sampled thread,stacktrace— the stack trace, ornullif the sampler failed to walk the stack,samplingPeriod— the sampling period at the time the sample was obtained, andbiased— whether the sample might be safepoint biased.
The rate of sampling for this event can be set through the event's throttle property, in two ways:
-
As a time period:
throttle=10mscauses a sample event to be produced for each platform thread after it consumes 10ms of CPU time. -
As an overall rate:
throttle=500/scauses 500 sample events to be produced every second, spread evenly over all platform threads.
The default throttle setting is 500/s, while in the profiling configuration included in the JDK, profile.jfc, it is 10ms. Higher rates produce a more accurate and precise profile at the cost of increasing the program's sampling overhead.
Another new event, jdk.CPUTimeSamplesLost, is emitted when samples are lost due to implementation constraints, such as internal data structures becoming full. Its lostSamples field contains the number of samples dropped in the last sampling round. This event ensures that the event stream, as a whole, correctly reflects the program's overall CPU activity. It is enabled by default, but emitted only when jdk.CPUTimeSample is enabled.
Because this feature is experimental, these JFR events are tagged as such with the @Experimental annotation on their JFR event type. Unlike other kinds of experimental features of the HotSpot JVM, these events do not need to be specially enabled by command-line options such as -XX:+UnlockExperimentalVMOptions.
Profiling in production
Continuous profiling, in which an application running in production is profiled throughout its lifetime, is gaining popularity. Choosing a throttle setting with a sufficiently low overhead can make it practical to collect CPU-time profiling information continuously in production.
If continuous CPU-time profiling in production is not possible, another option is to occasionally gather a CPU profile. First, create an appropriate JFR configuration file:
$ jfr configure --input profile.jfc --output /tmp/cpu_profile.jfc \
  jdk.CPUTimeSample#enabled=true jdk.CPUTimeSample#throttle=20ms
Then use the jcmd tool to start a recording for the running program, using that configuration:
$ jcmd <pid> JFR.start settings=/tmp/cpu_profile.jfc duration=4mHere the recording stops after four minutes, but we can choose other durations or, alternatively, manually stop the recording after a while via jcmd <pid> JFR.stop.
As with every JFR event, jdk.CPUTimeSample events can be streamed as they are recorded, even over the wire to a remote consumer, for online analysis.
Alternatives
We could enable external tools to use the Linux CPU-time sampler by adding safe and supported native HotSpot APIs for that purpose. Doing so would, however, expose internal details of the runtime, which would make the JDK harder to evolve. This approach would also be less efficient, and thus less suitable for profiling in production, than implementing the feature directly in the JDK.
Dependencies
The implementation of this feature leverages the cooperative-sampling mechanism introduced by JEP 518.